Token Market Analysis API

Mobula.io has recently introduced a new tab on its asset pages, offering users a comprehensive and in-depth view of market trends and asset performance. This innovative feature provides valuable insights into various cryptocurrencies, including a detailed analysis of their performance relative to the overall market. In this blog post, we will explore the information the Market tab provides, focusing on the example of Sui.
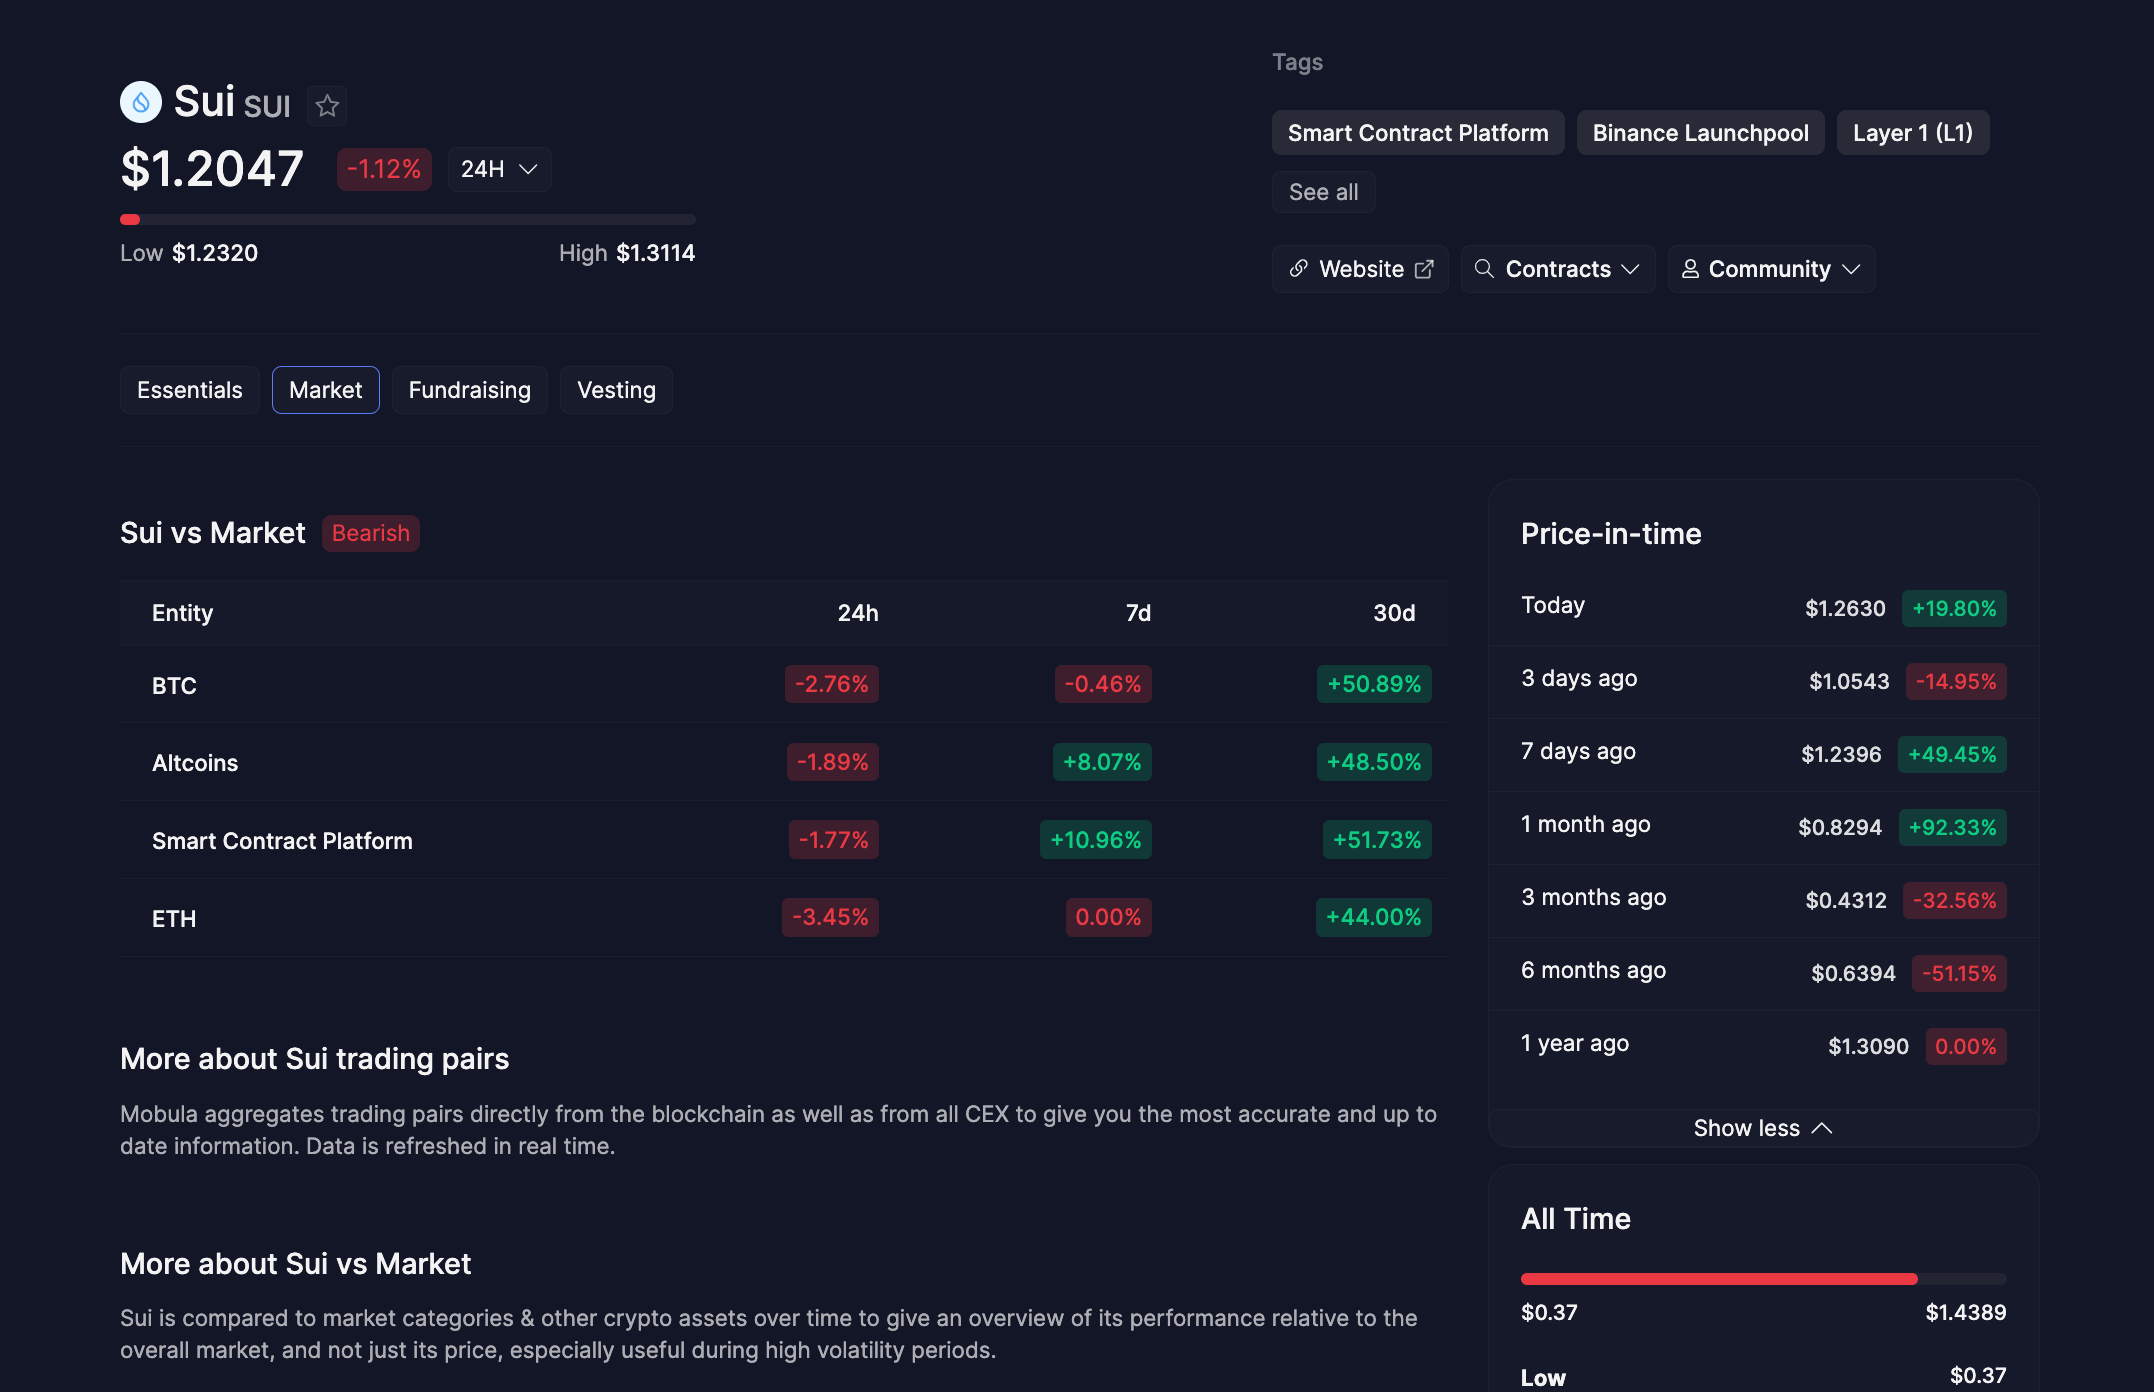
Understanding the Market Tab: Sui vs. Market Analysis
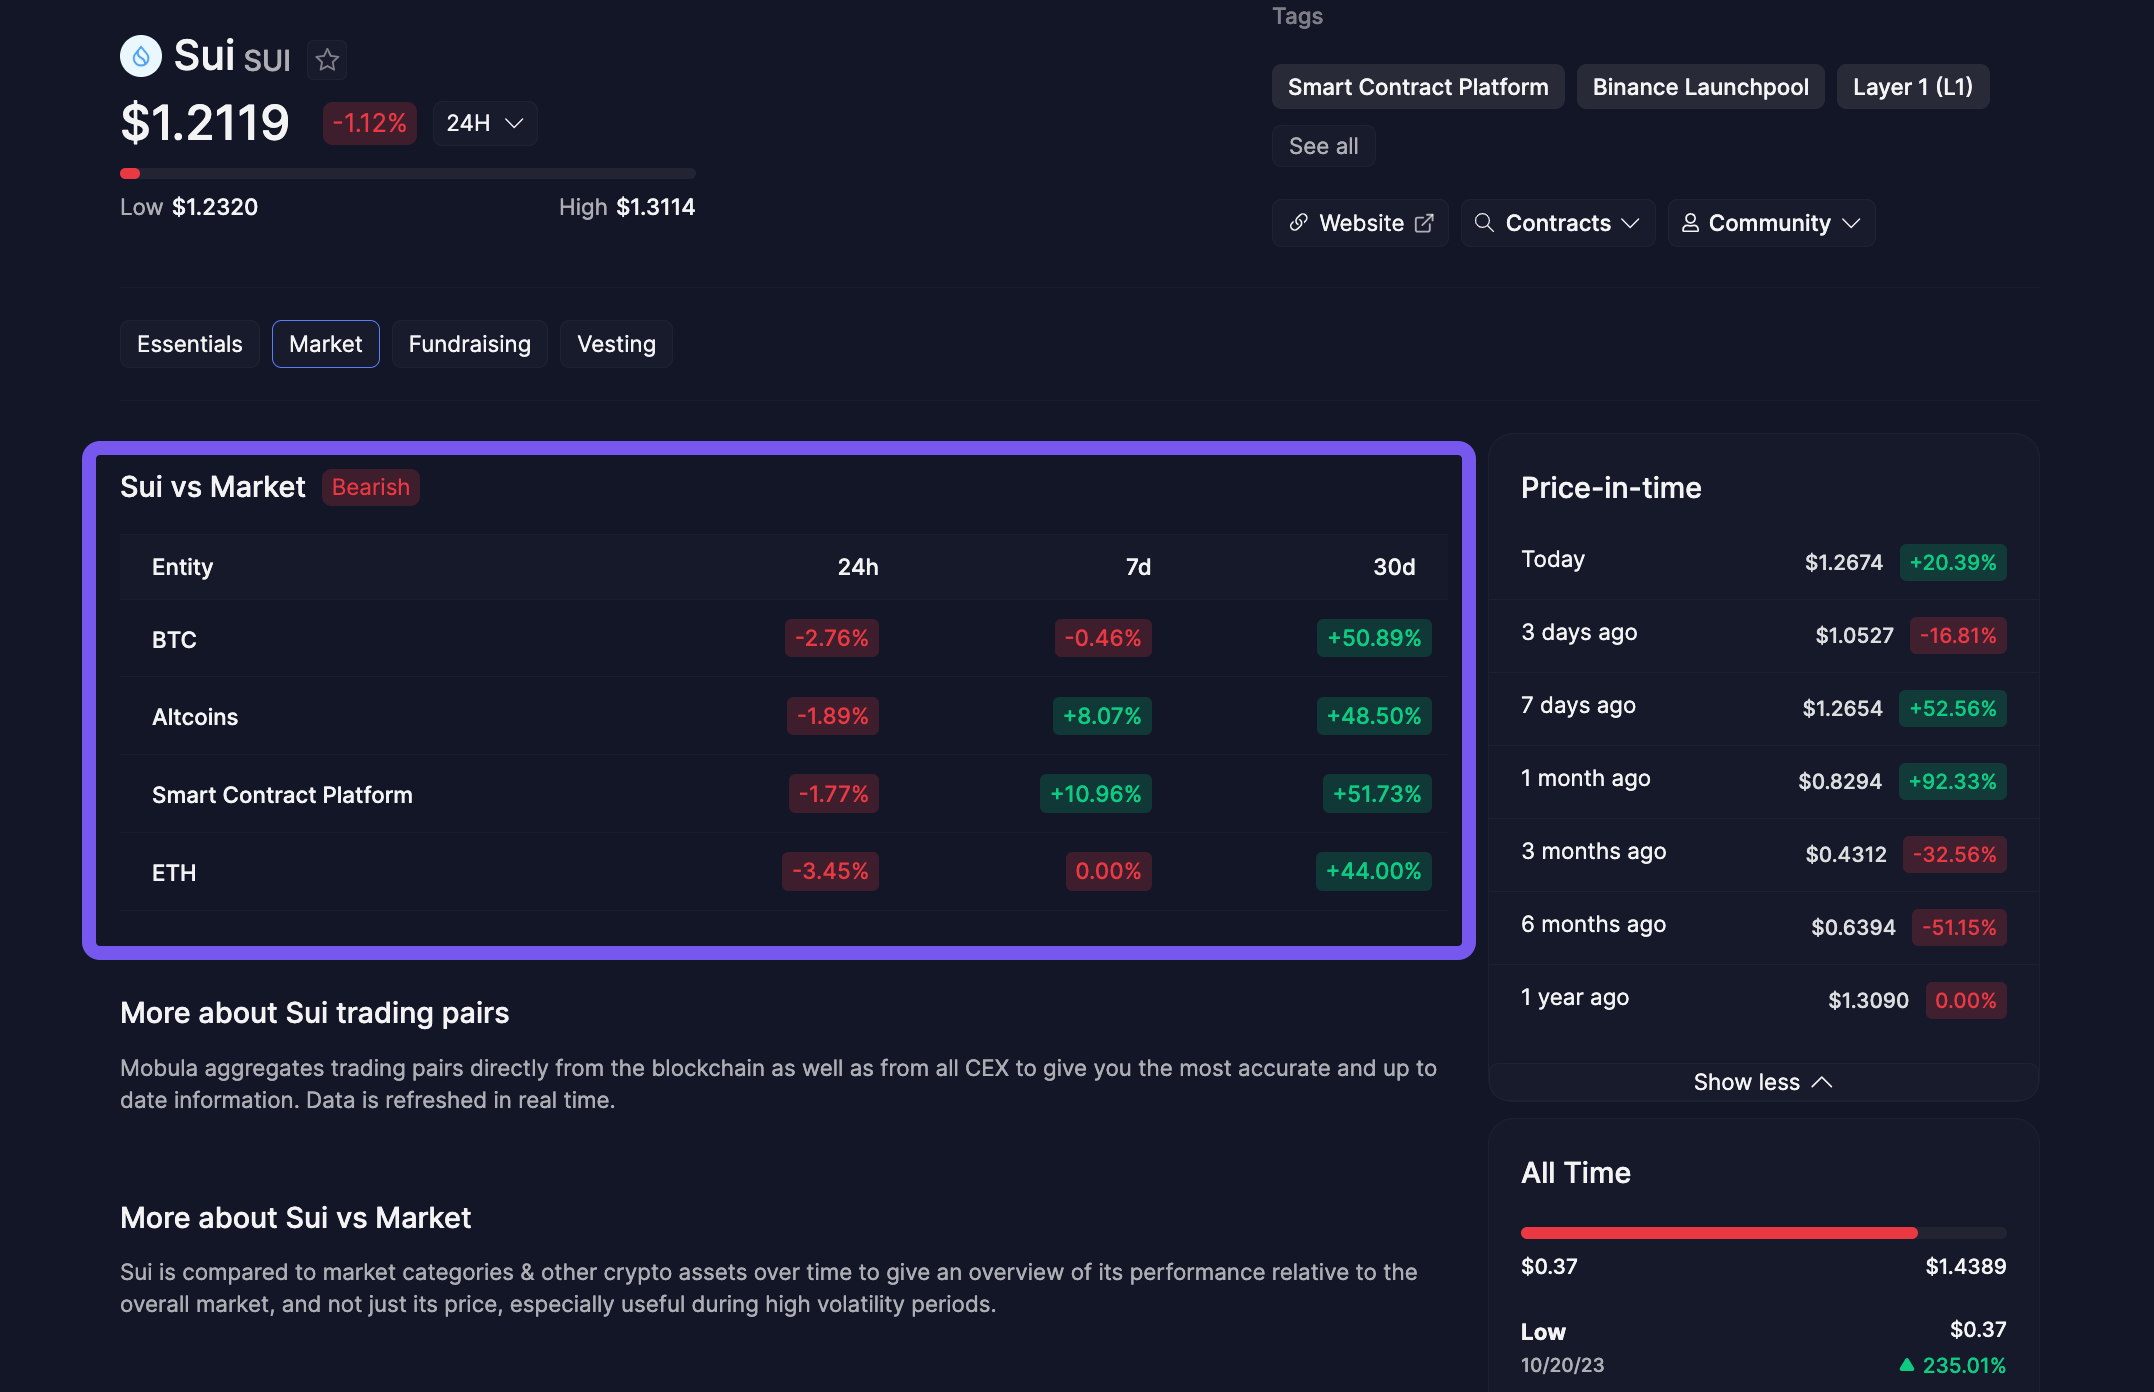
The Market tab on Mobula.io's asset pages presents a clear and concise comparison of a particular asset, like Sui, against various market categories. For instance, users can see how Sui has performed relative to BTC, Altcoins, Smart Contract Platforms, and ETH over different time frames such as 24 hours, 7 days, and 30 days. This tab gives a snapshot of the market sentiment, whether bullish or bearish, helping users make informed decisions during periods of high volatility.
Real-Time Data Aggregation
Mobula is aggregating trading pairs directly from the blockchain and all CEX, ensuring the most accurate and up-to-date information. This real-time data refresh capability is particularly valuable for users who need to stay ahead of market trends and asset price movements.
Sui and BTC Trading Pairs: A Detailed Timeline Analysis
The Market tab on Mobula.io is a strategic tool that sheds light on the performance of cryptocurrencies like Sui when paired with BTC, one of the most pivotal assets in the crypto market. Users can track the performance timeline, analyzing the responsiveness of Sui relative to BTC over various intervals—24 hours, 7 days, and 30 days. This timeline is essential for traders who aim to understand the immediate and short-term market sentiments influencing these pairs.
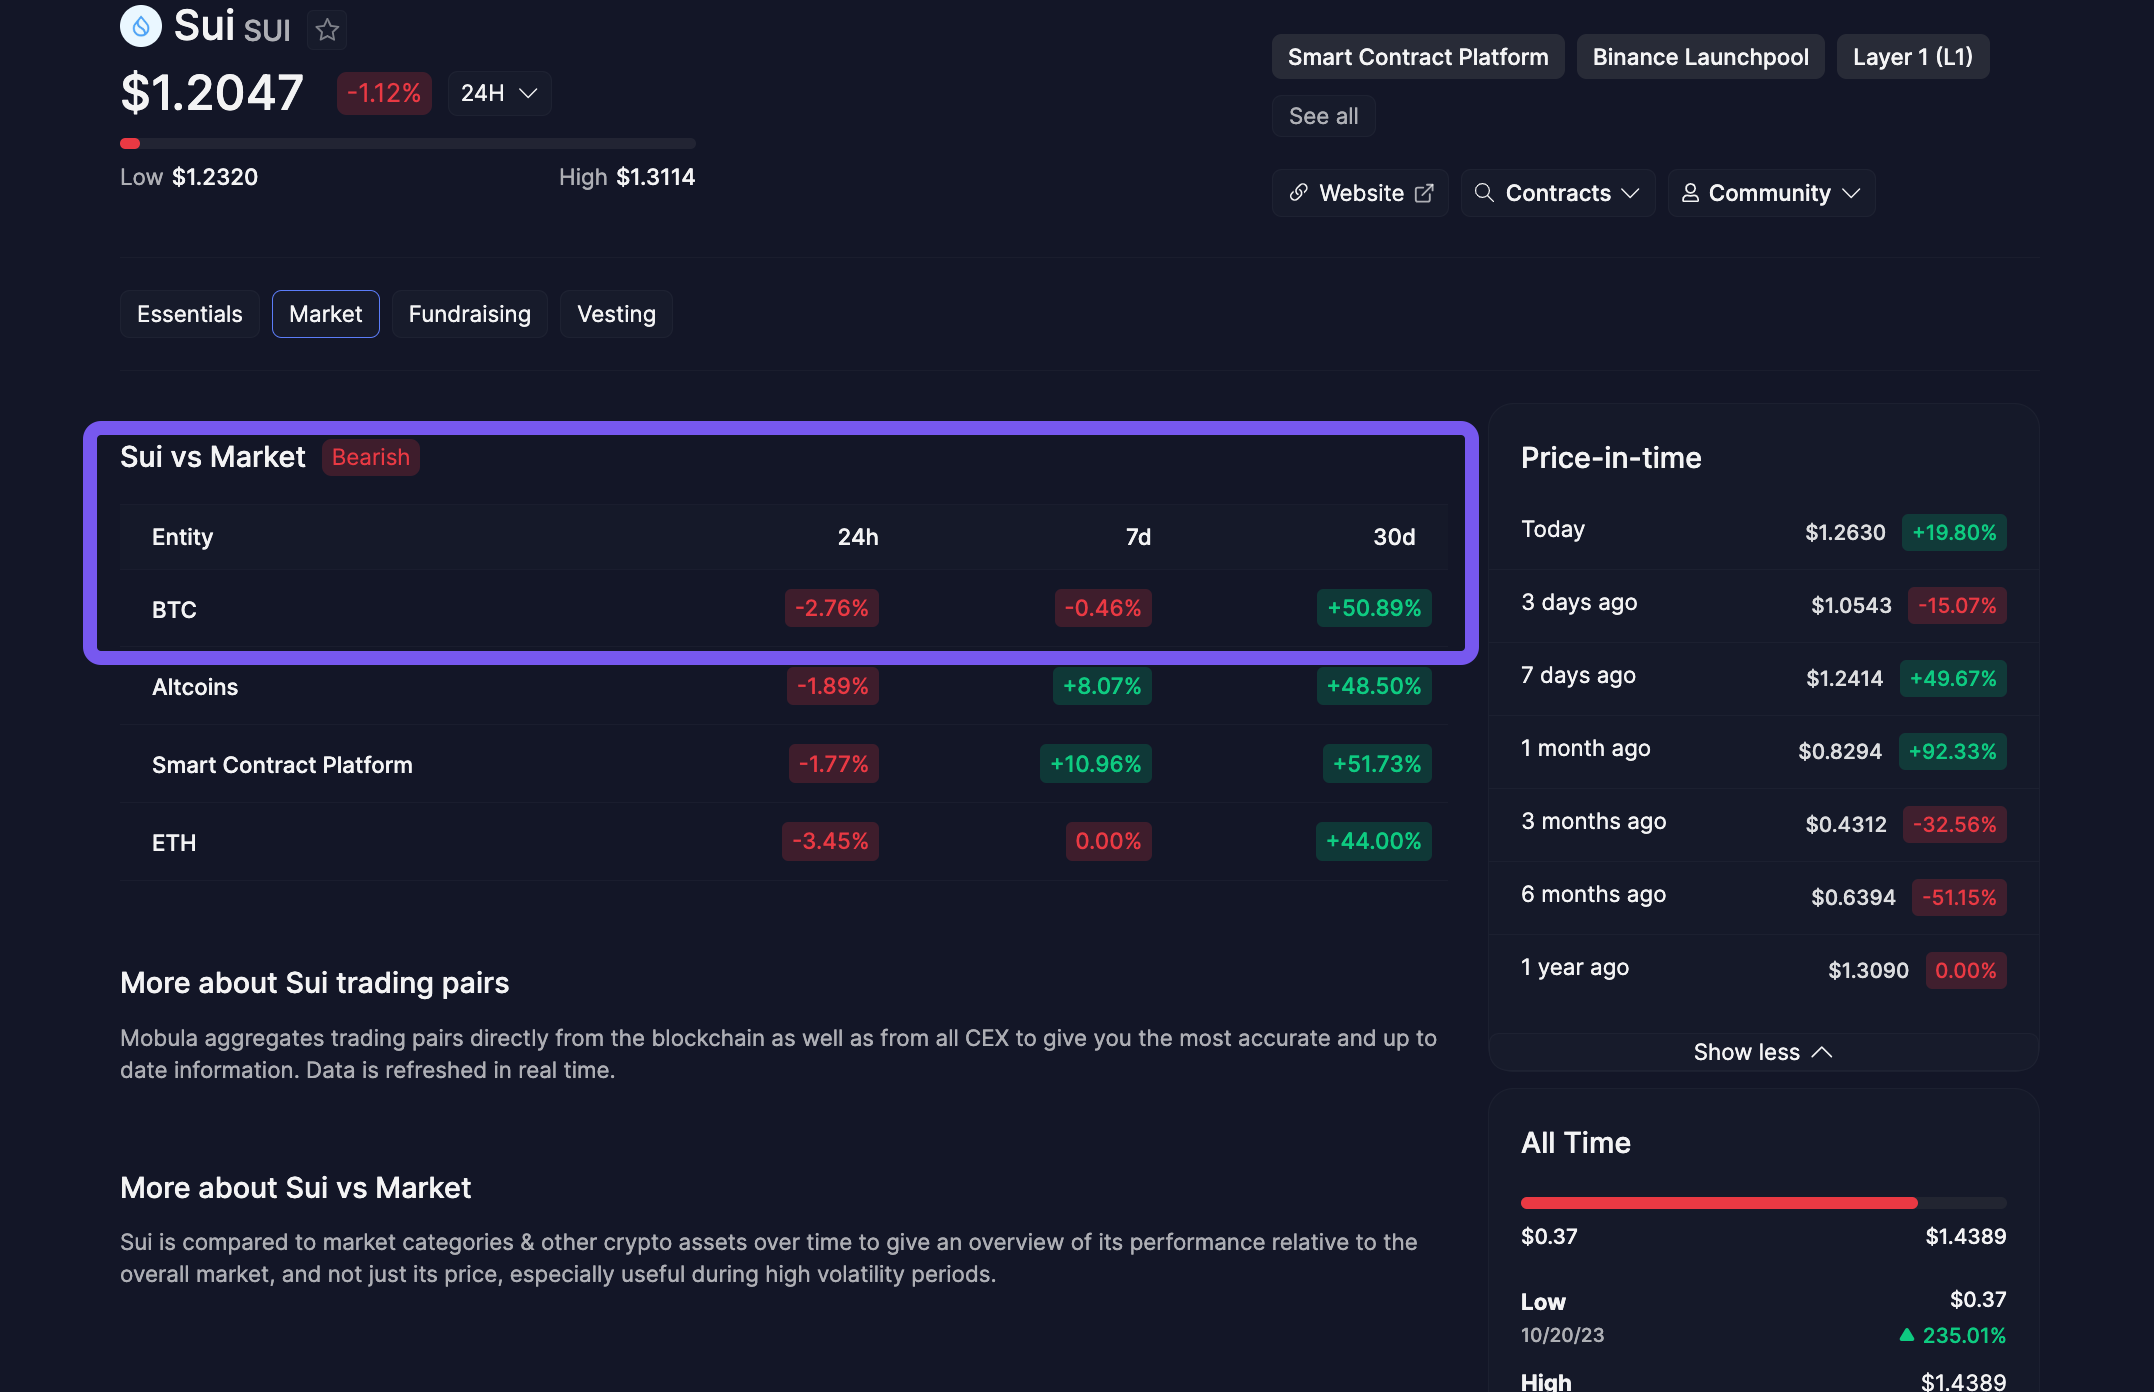
Altcoins and Smart Contract Platforms: Sui in Perspective
Mobula goes beyond BTC, offering comparisons with broader categories like Altcoins and Smart Contract Platforms. For Sui, this means understanding its position and performance not just in isolation but within the context of these categories. The Market tab's detailed breakdown includes percentage changes that paint a picture of Sui's market performance, helping traders identify patterns and make predictions based on comprehensive data.
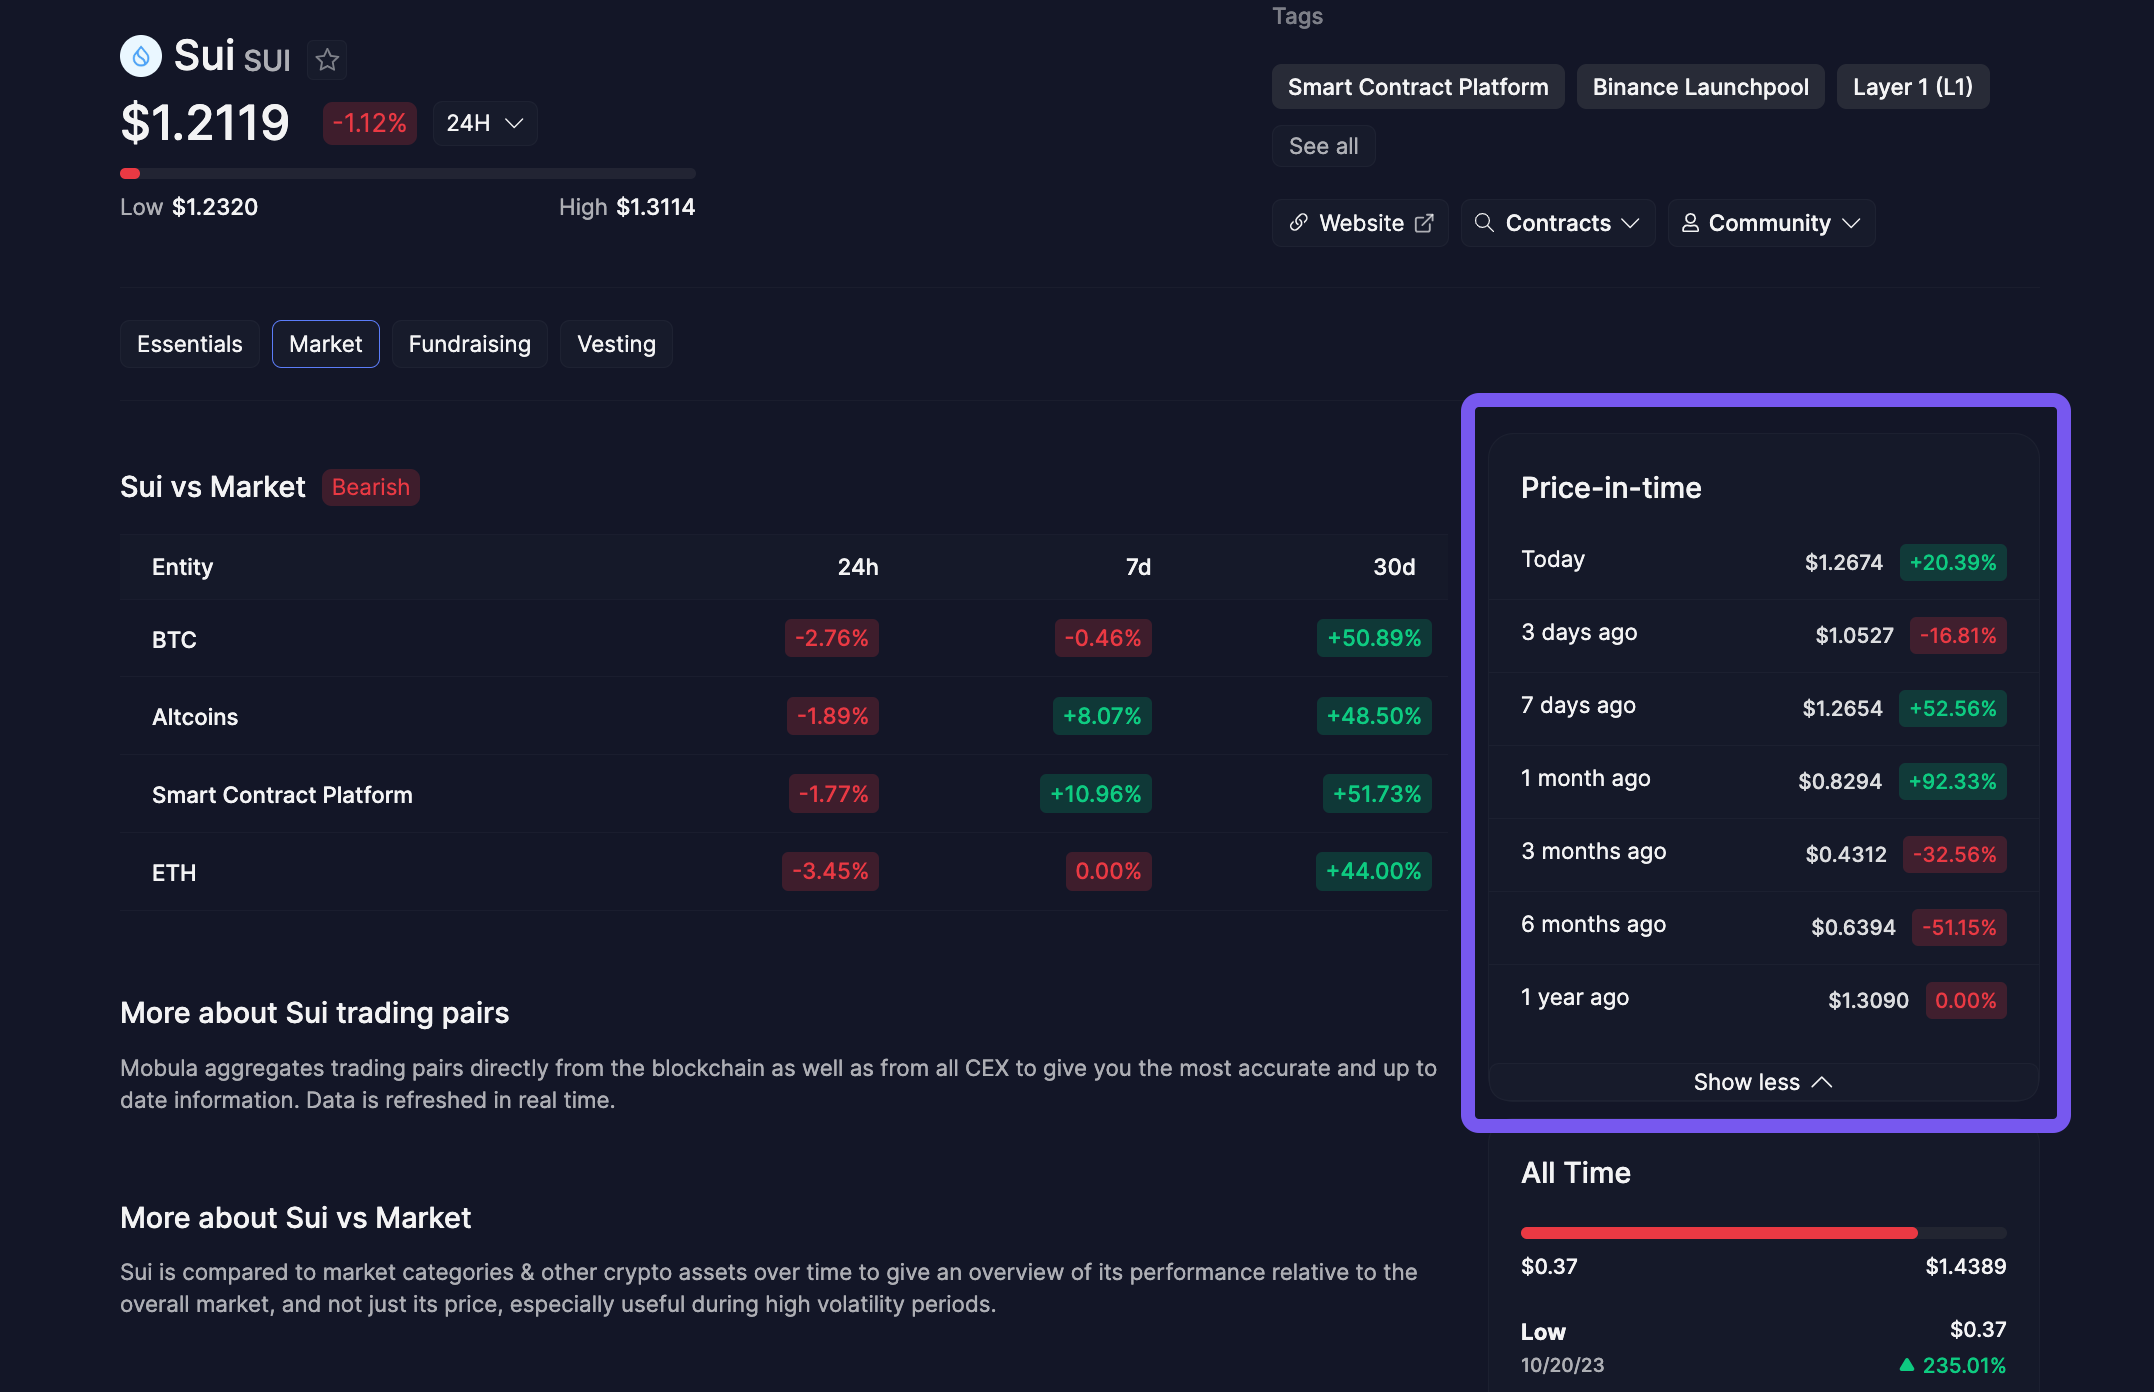
Price-in-time: A Comprehensive Historical View
Users can also explore the 'Price-in-time' section, which details Sui's price changes over various periods, including today, 3 days ago, 7 days ago, 1 month ago, 3 months ago, 6 months ago, and 1 year ago. This historical data, coupled with percentage changes, offers a thorough understanding of the asset's long-term performance.
• Request a new blockchain
• Request a new endpoint
• Need something else