Analyzing Ethereum Data with Mobula's API
Creating a web app for historical data analysis of assets using React and Tailwind CSS is an excellent way to build a user-friendly and visually appealing application.
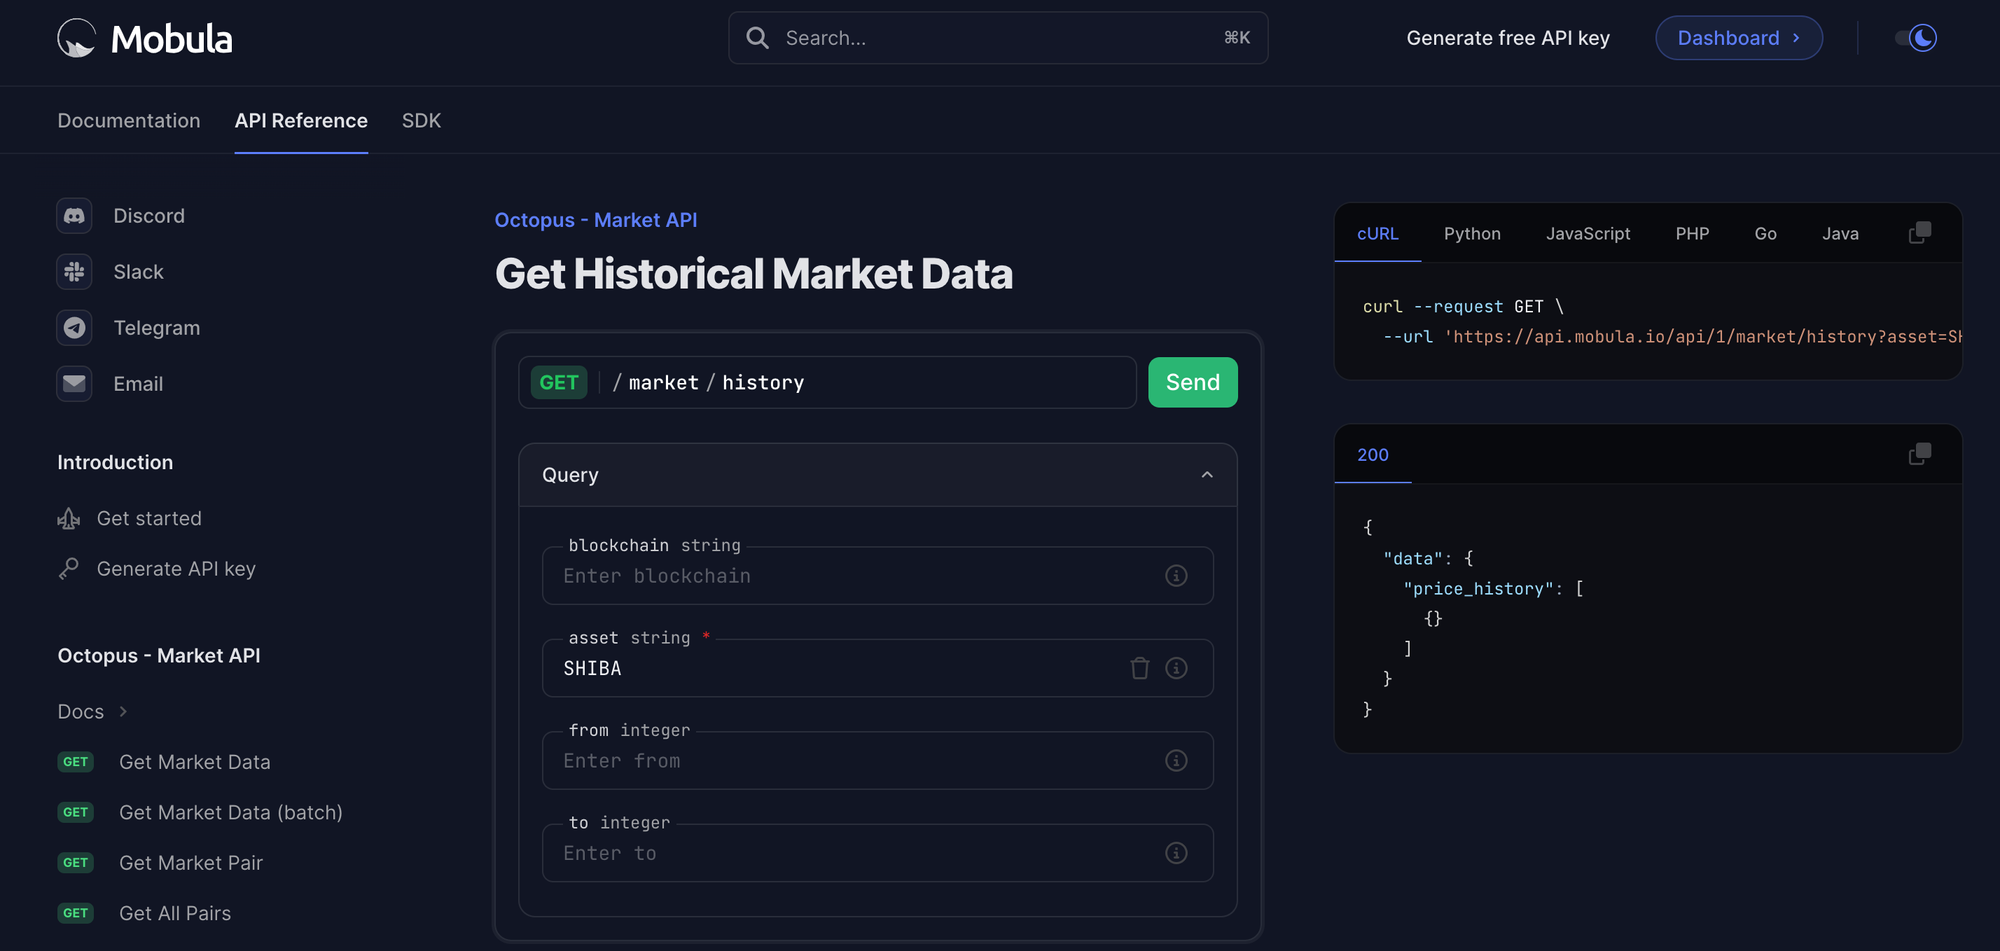
In this tutorial, you will use Mobula's API to analyze Ethereum's historical price. Mobula's API provides access to various blockchains and asset data, making it a powerful tool for analysis.
How to Get Mobula API
- Go to Mobula's doc
- Click on the "Generate API Key" button and register to obtain your free API key.
Prerequisites
Before you start, make sure you have the following:
- Mobula API Key: A key from Mobula just here: https://admin.mobula.fi/
- Nodejs: Ensure you have Node.js and npm (Node Package Manager) installed on your computer. If you haven't already, you can install them from the official website: Node.js.
Step 1: Create a New React App
Start by creating a new React app using Create React App. Open your terminal and run the following commands:
npx create-react-app eth-analysis-app
cd eth-analysis-app
Step 2: Install Dependencies
In your project folder, install the necessary dependencies. You'll need Axios for making API requests and Tailwind CSS for styling:
npm install axios tailwindcss
Step 3: Create Components
In the src Folder, create the following components:
- DataFetcher.js: This component will fetch historical price data from Mobula's API.
- Chart.js: This component will render the data using Chart.js.
- Report.js: This component will generate reports based on the data.
Step 4: Implement DataFetcher Component
In DataFetcher.js, use Axios to fetch historical blockchain data from Mobula's API.
Add this code to DataFetcher.js:
// DataFetcher.js
// DataFetcher.js code here
import axios from "axios";
import React, { useEffect, useState } from "react";

const DataFetcher = ({ onDataFetched }) => {
  const [data, setData] = useState([]);

  useEffect(() => {
    async function fetchData() {
      try {
        const response = await axios.get(
          "https://api.mobula.io/api/1/market/history",
          {
            params: {
              asset: "Ethereum",
            },
            headers: {
              Authorization: "b303c1d0-0c44-4332-9179-791dd08b5275",
            },
          }
        );
        setData(response.data.data.price_history);
        onDataFetched(response.data.data.price_history);
      } catch (error) {
        console.error("Error fetching data from Mobula API:", error);
      }
    }

    fetchData();
  }, []);

  return <div>{/* Render your data here */}</div>;
};

export default DataFetcher;
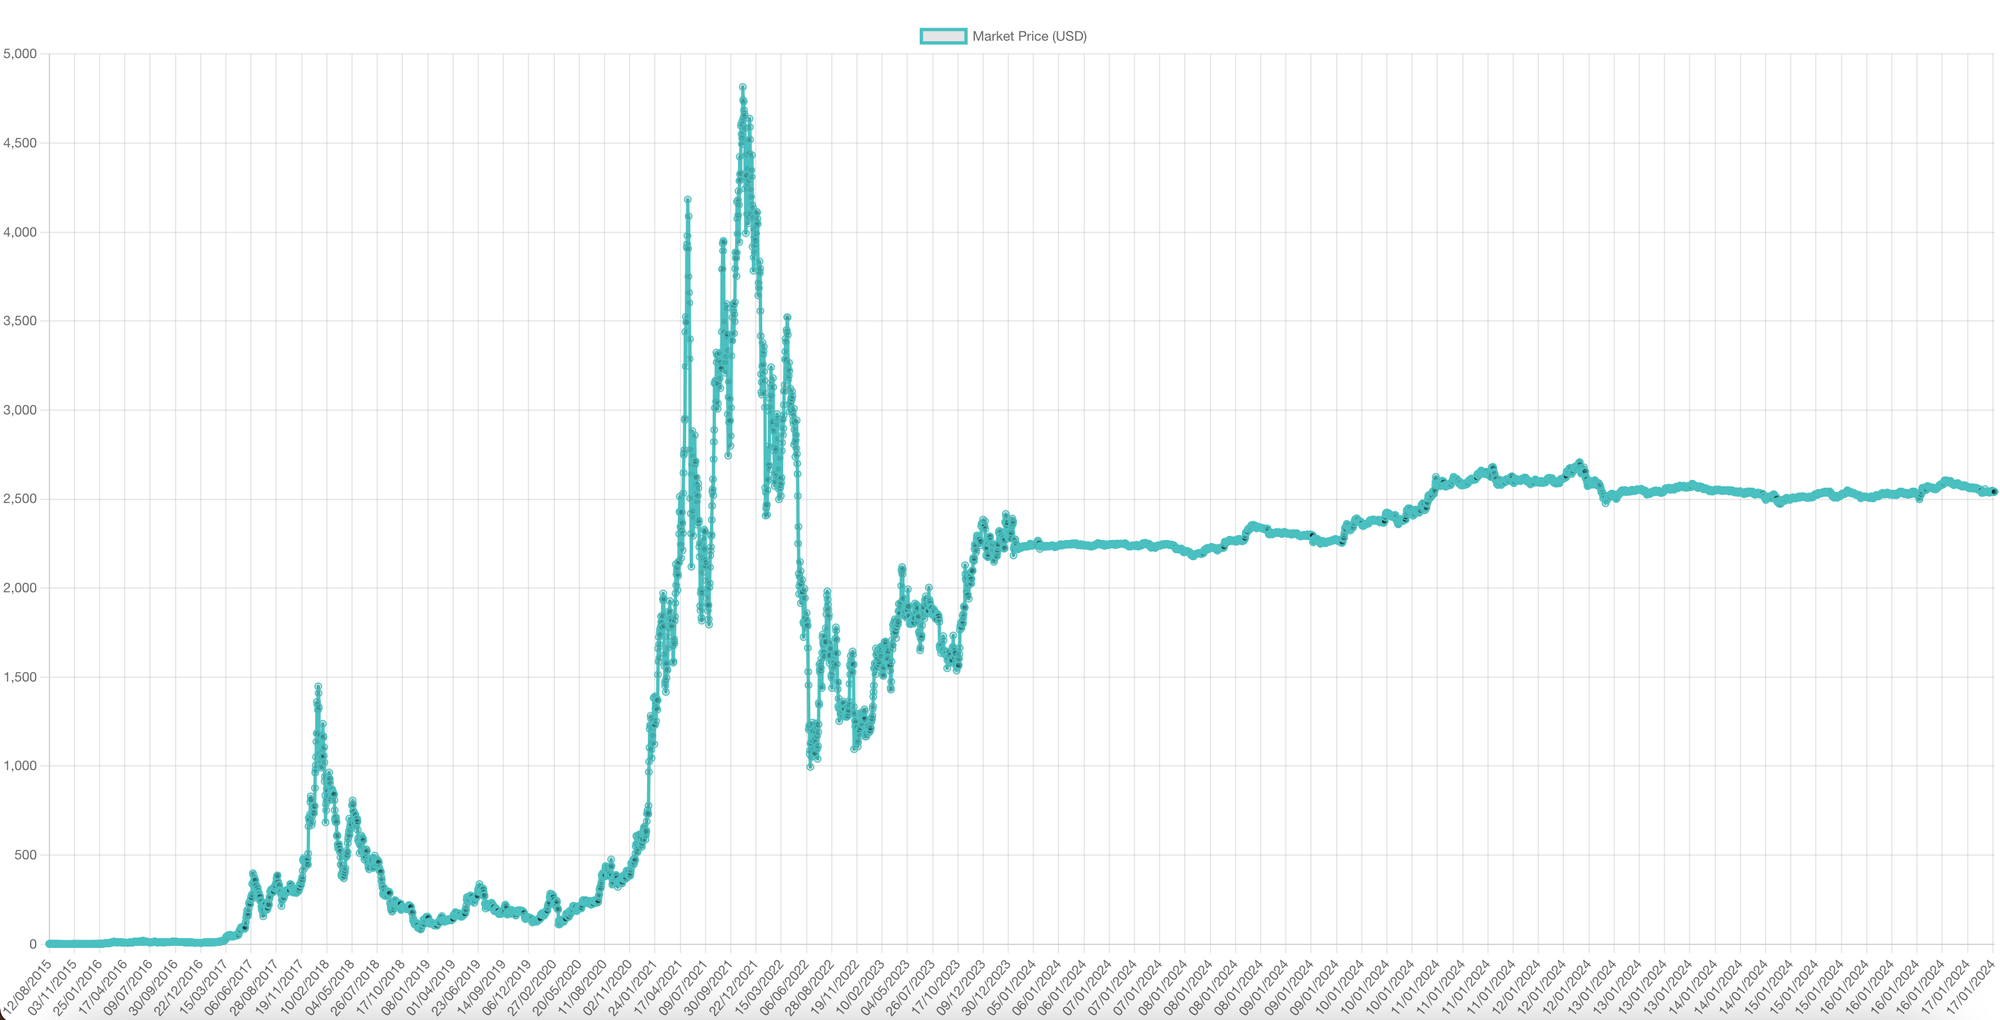
Step 5: Implement Chart Component
In Chart.js, use Chart.js to create visualizations from the historical data. Add this code to Chart.js:
// Chart.js
import React, { useEffect, useRef } from "react";
import Chart from "chart.js/auto";

const ChartComponent = ({ data }) => {
  const chartRef = useRef(null);

  useEffect(() => {
    if (chartRef.current && data) {
      const chartContext = chartRef.current.getContext("2d");
      new Chart(chartContext, {
        type: "line",
        data: {
          labels: data.map(d => new Date(d[0]).toLocaleDateString()),
          datasets: [{
            label: 'Market Price (USD)',
            data: data.map(d => d[1]),
            borderColor: 'rgb(75, 192, 192)',
            tension: 0.1
          }]
        }
      });
    }
  }, [data]);

  return <canvas ref={chartRef}></canvas>;
};

export default ChartComponent;
This component will render a line chart based on the historical data provided.
Error with Chart.js Installation
If you encounter an error related to chart.js, such as "Module not found: Error: Can't resolve 'chart.js/auto'", it's likely due to the chart.js library not being installed properly in your project. To fix this issue:
-
Install Chart.js: Run the following command in your project directory to ensure that
chart.jsis installed:npm install chart.js -
Verify Import Statement: Make sure that the import statement in your
Chart.jscomponent is correct. Forchart.jsversion 3 and above, it should be:import Chart from 'chart.js/auto';Adjust the import statement according to the version of
chart.jsyou are using. -
Recompile the Project: After installing
chart.js, restart your development server to ensure the changes take effect:npm start
By following these steps, you should be able to resolve any installation or import issues related to chart.js.
Step 6: Implement Report Component
In Report.js, generate reports based on historical blockchain data. Add this code to Report.js:
// Report.js
import React from "react";

const Report = ({ data }) => {
  // Implement logic to generate reports from the data
  return <div></div>;
};

export default Report;
Step 7: Styling with Tailwind CSS
Tailwind CSS allows you to style your React components easily. You can customize the appearance of your components by adding Tailwind CSS classes directly to your JSX elements.
For example, in the code provided, Tailwind CSS classes are used for styling.
Step 8: Use Components in App.js
In src/App.js, use the created components to display the data, visualizations, and reports. Add this code to App.js:
// App.js
import React, { useState } from 'react';
import DataFetcher from './DataFetcher';
import ChartComponent from './Chart';
import Report from './Report';

function App() {
  const [marketData, setMarketData] = useState([]);

  return (
    <div className="App">
      <h1>Ethereum Market Data Analysis</h1>
      <DataFetcher onDataFetched={setMarketData} />
      <ChartComponent data={marketData} />
      <Report data={marketData} />
    </div>
  );
}

export default App;
Step 9: Start the Development Server
Start your React app with the following command:
npm start
Your app will be available in your web browser at http://localhost:3000. It will fetch historical blockchain data, display it in a chart, and generate a simple report, all styled using Tailwind CSS.
Conclusion
In this tutorial, you have seen how to use Mobula's API to access and analyze Ethereum's historical data price. By leveraging the power of Mobula, you can gain insights into the Ethereum historical price movement and make informed decisions based on blockchain data.
You can extend this analysis to multiple assets, timeframes, or any other criteria you need for your project.
• Request a new blockchain
• Request a new endpoint
• Need something else